
Analytics overview
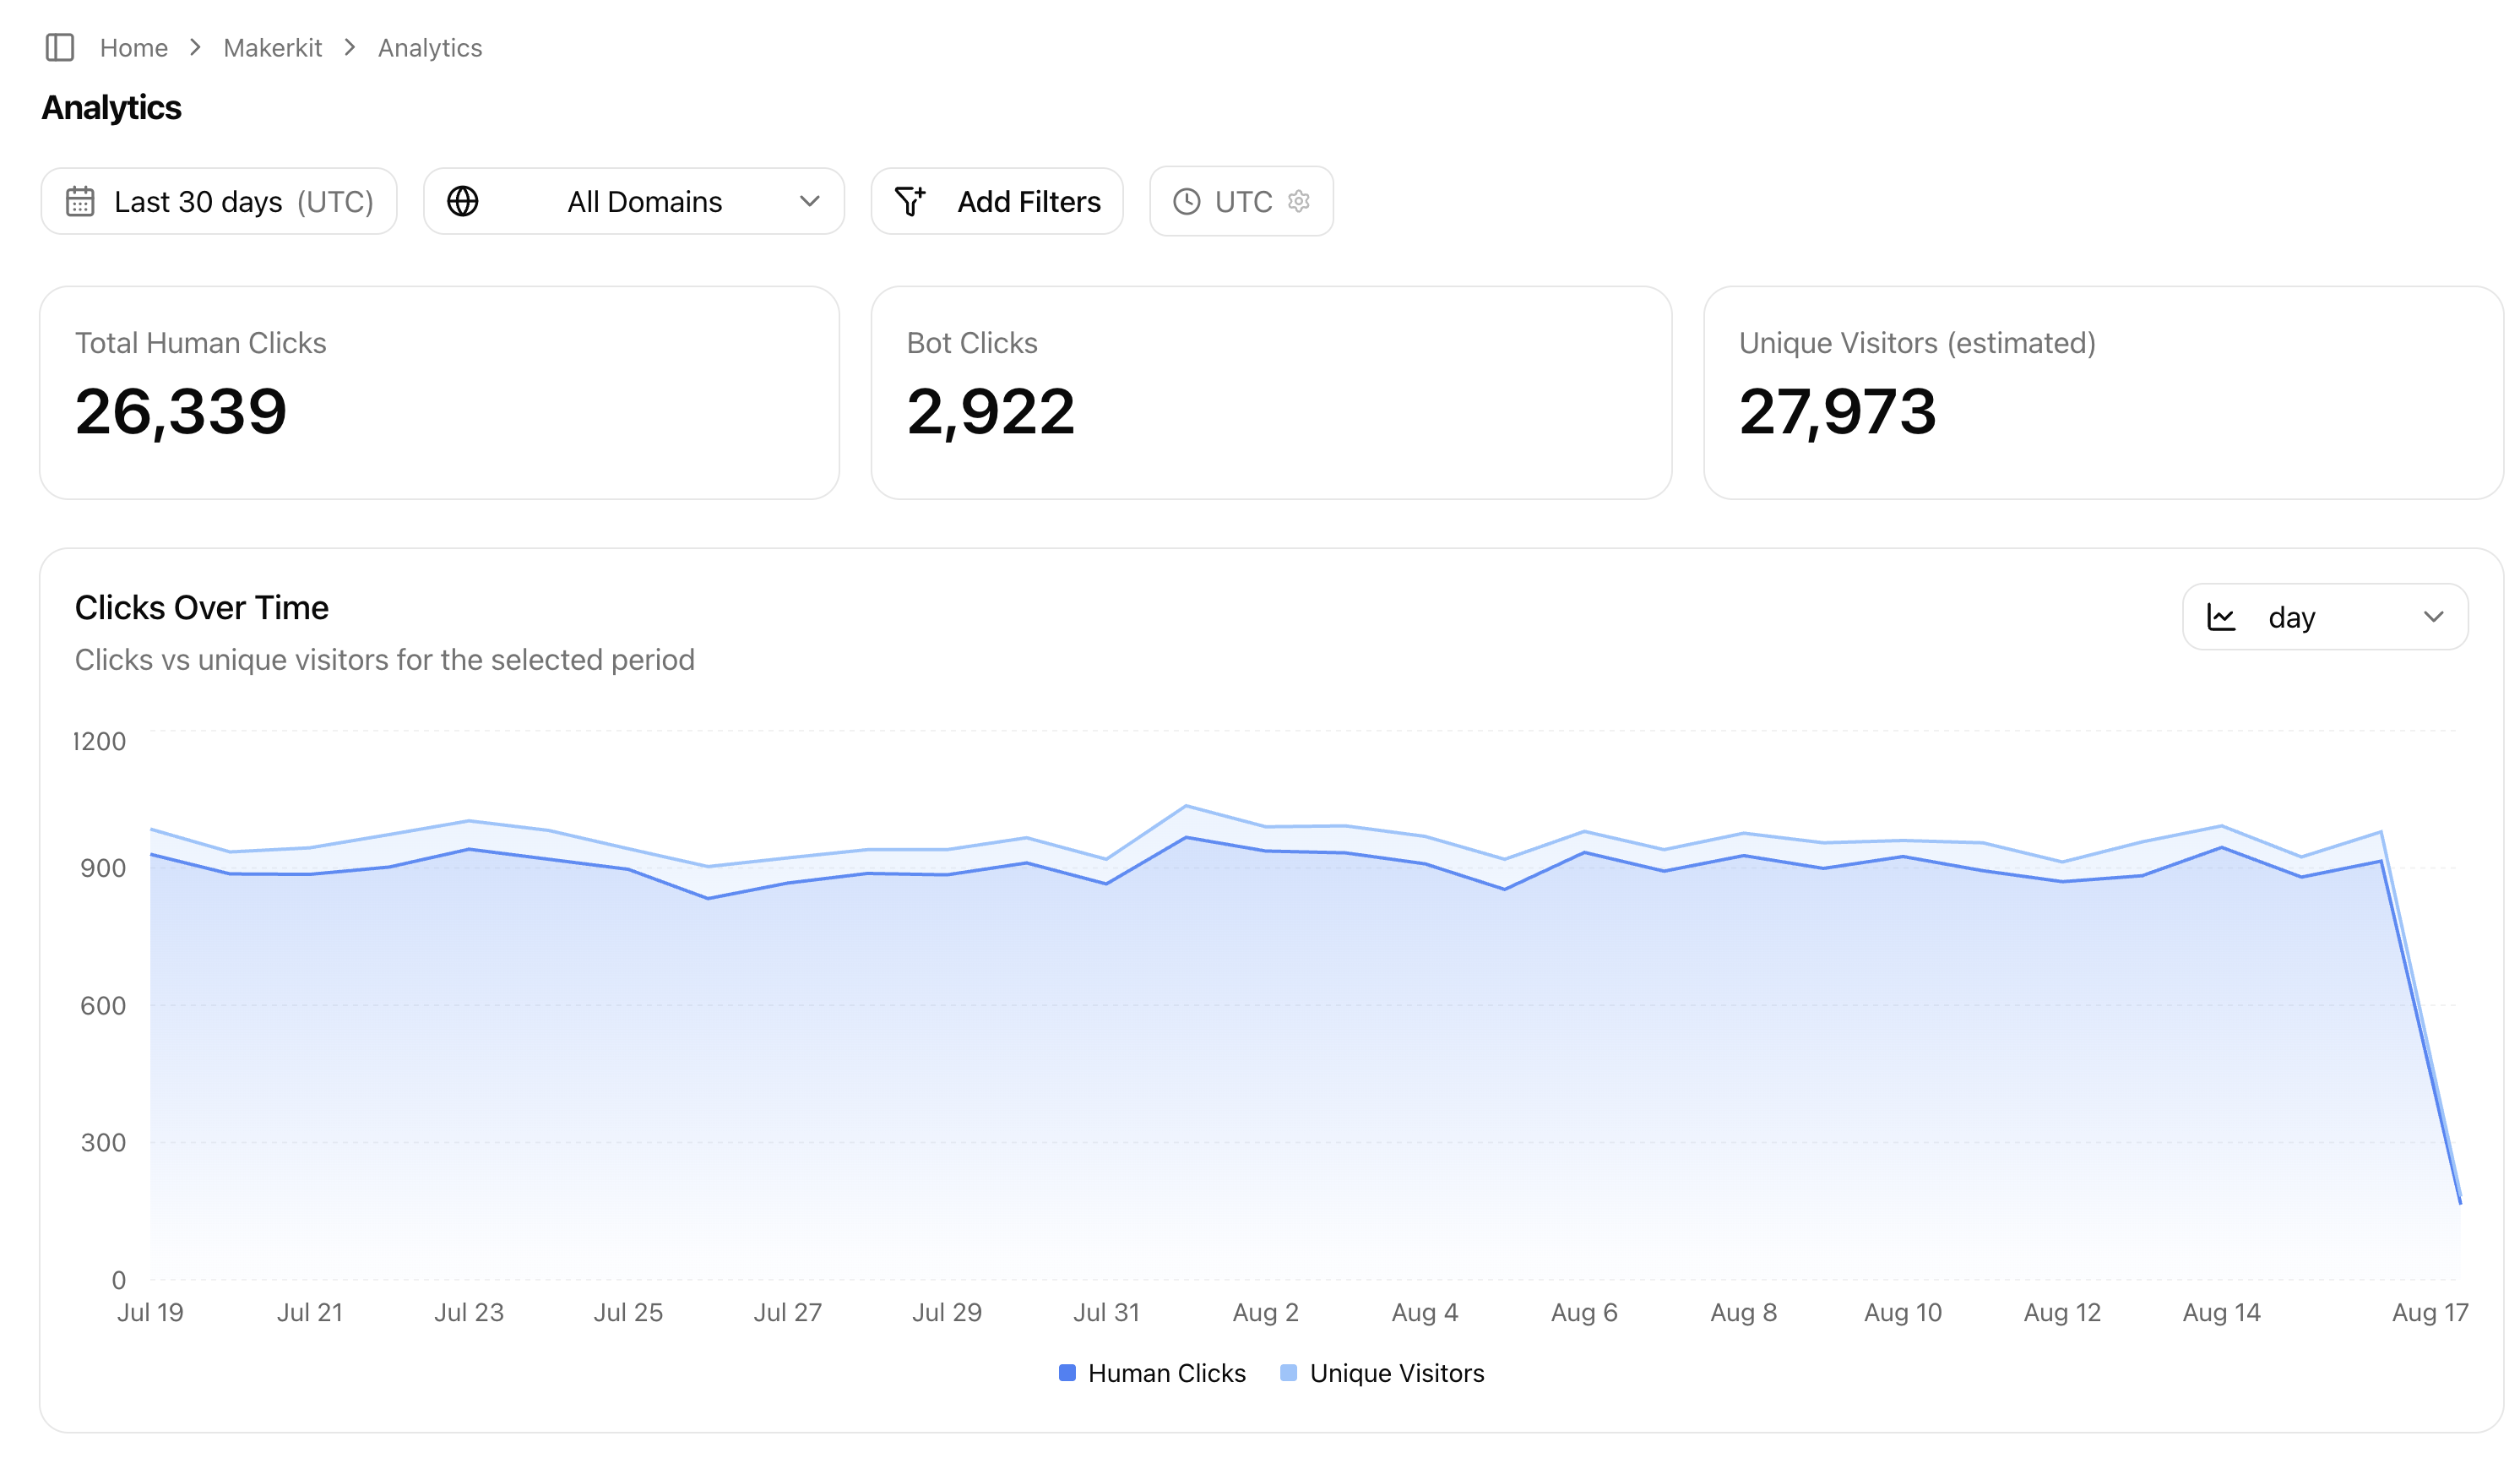
The Analytics section helps you understand how people interact with your short links and QR codes.
You can see how many times your links were clicked, where visitors came from, which devices they used, which links perform best, and more.
Analytics can be viewed across all of your domains or narrowed down to specific links, locations, devices, and other conditions.
Analytics Controls
At the top of the Analytics page, you can control what data is shown throughout the dashboard.

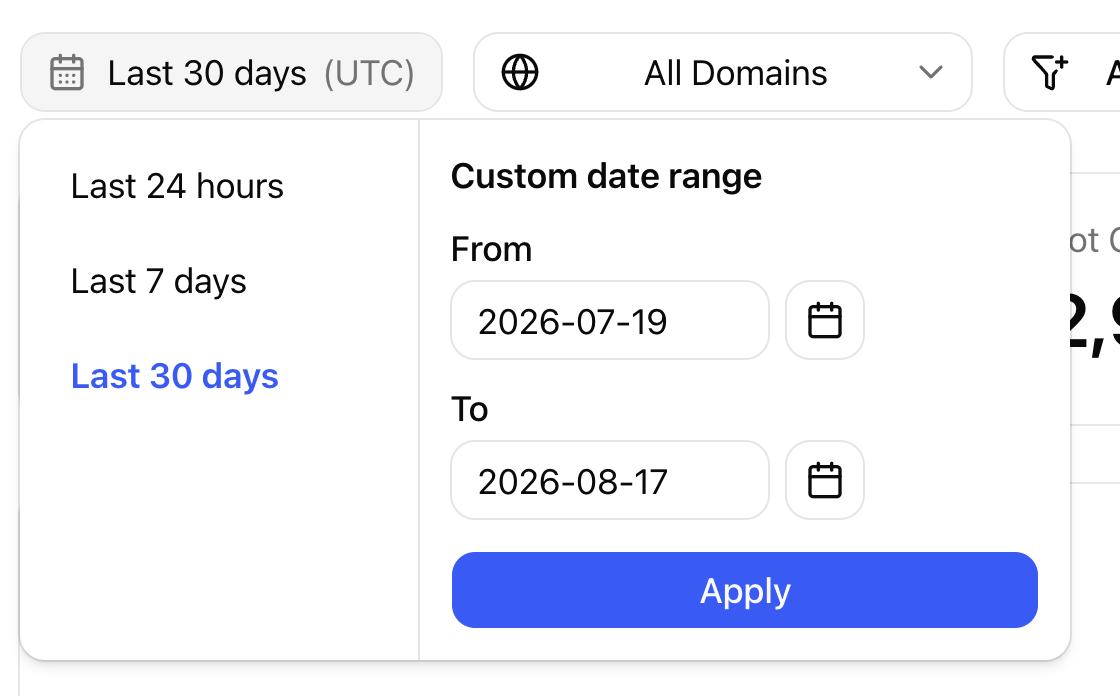
Date Range
Choose the period you want to analyze, such as the last 7 days, last 30 days, or a custom date range.
All charts and statistics on the page will update to match the selected period.
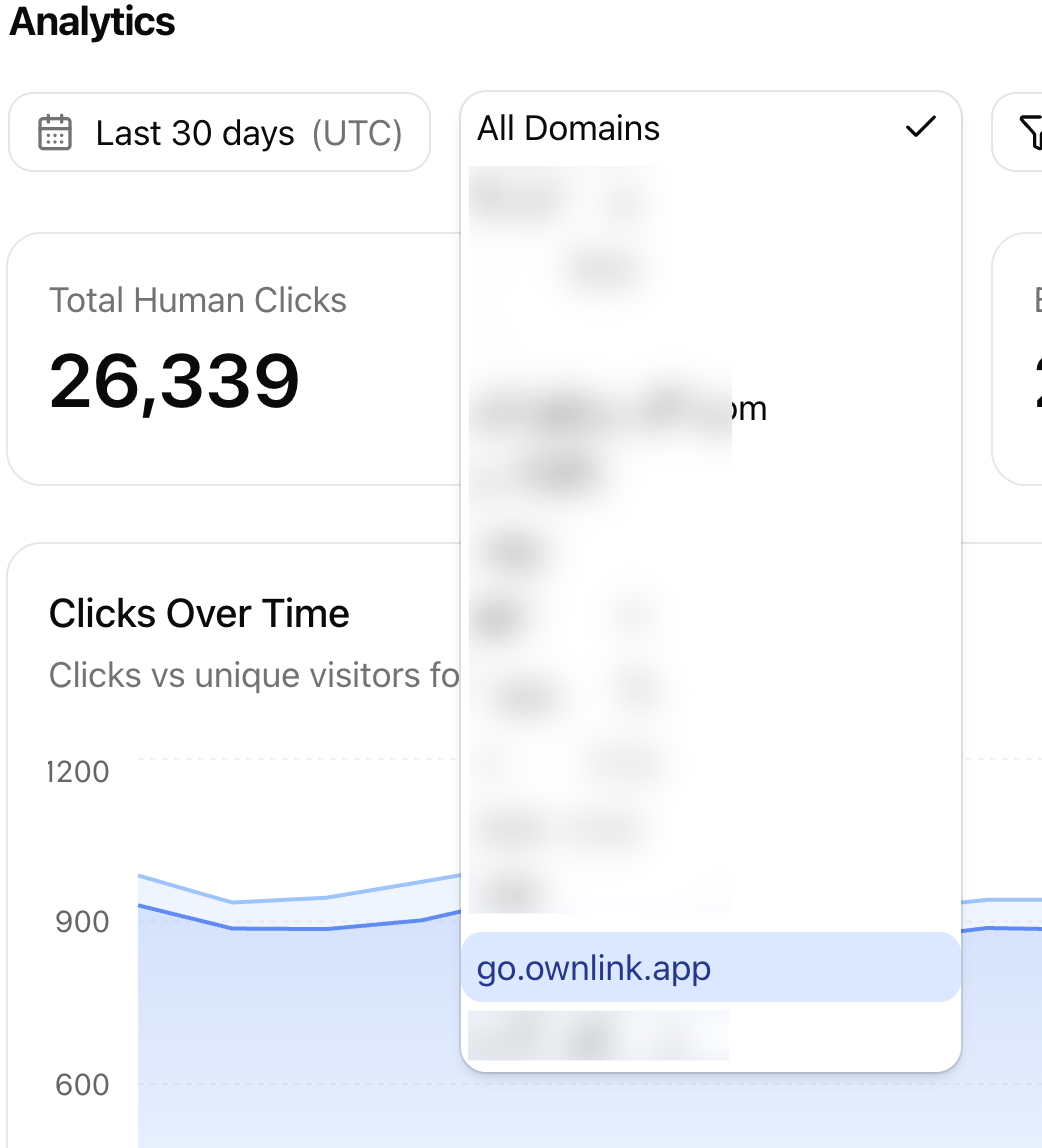
Domain
Use the domain selector to view:
- Analytics across all domains
- Analytics for one specific domain
This is useful if you use several branded domains and want to compare their traffic separately.
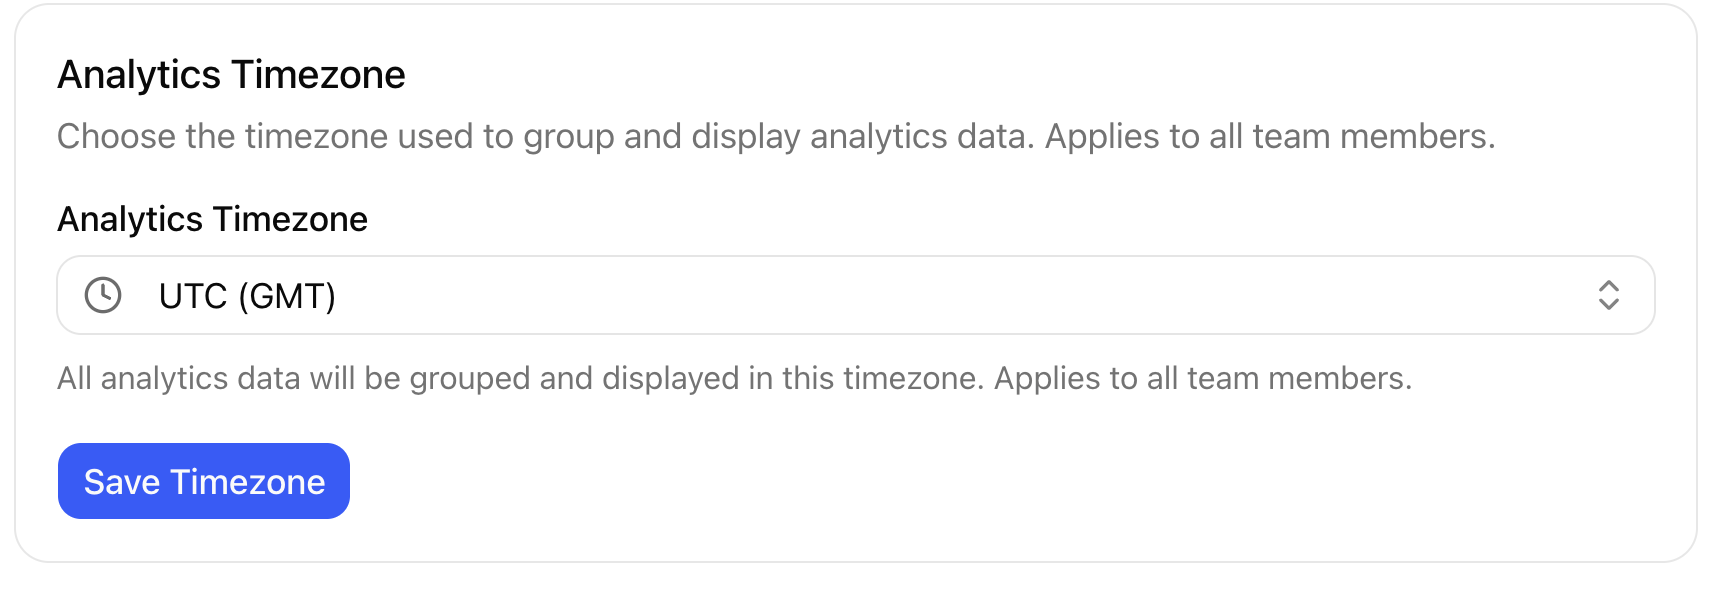
Timezone
Analytics can be displayed using your selected timezone.
The timezone affects how clicks are grouped by hour or day. For example, a click happening late at night may belong to a different calendar day depending on the timezone you select.
To change analytics timezone - click on the timezone button and change it from account settings.

Filters
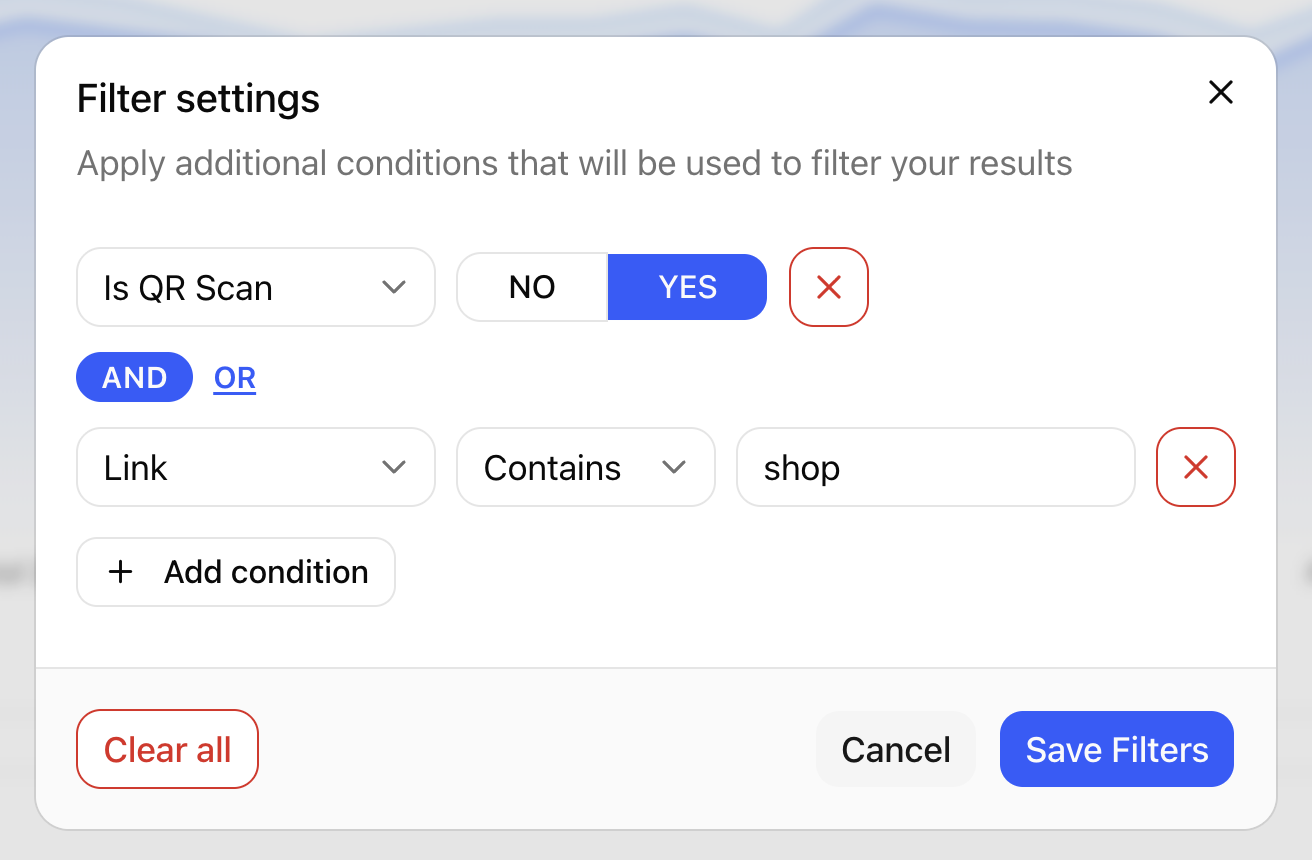
Use Add Filters when you want to analyze a specific part of your traffic instead of all clicks.
You can add conditions based on available analytics properties, such as a particular link.
For example, you could filter the dashboard to show traffic only for:
/discord
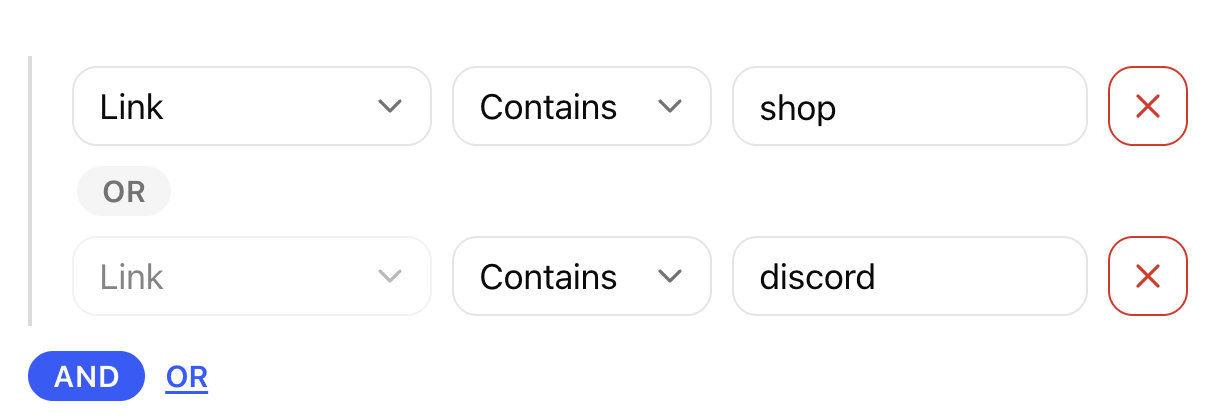
Multiple conditions can be combined using AND or OR.
- AND means all conditions must match.
- OR means at least one of the conditions must match.
For example:
Link = discord OR Link = shop
would show analytics for both links.
After saving the filters, they are applied to the analytics results throughout the page.
Total Human Clicks
Total Human Clicks shows the number of clicks that Ownlink identified as coming from real visitors during the selected period.
Repeated clicks from the same person are counted separately.
For example, if one visitor opens the same link three times, this normally counts as 3 human clicks.
Traffic identified as bots is excluded from this number.
Bot Clicks
Bot Clicks shows requests that Ownlink identified as automated traffic rather than normal visitors.
Bots can include things such as:
- Search engine crawlers
- Social media link preview bots
- Monitoring services
- Automated scanners
- Other automated requests
Keeping bot traffic separate helps prevent automated activity from making your normal click statistics appear higher than they actually are.
Unique Visitors
Unique Visitors estimates how many different visitors opened your links during the selected period.
Unlike total clicks, multiple clicks from the same visitor are generally counted as a single visitor.
For example:
- One visitor clicks a link 5 times → 5 clicks
- That visitor may still represent → 1 unique visitor
Unique visitor counts are estimated because Ownlink does not require visitors to log in or identify themselves.
Clicks Over Time
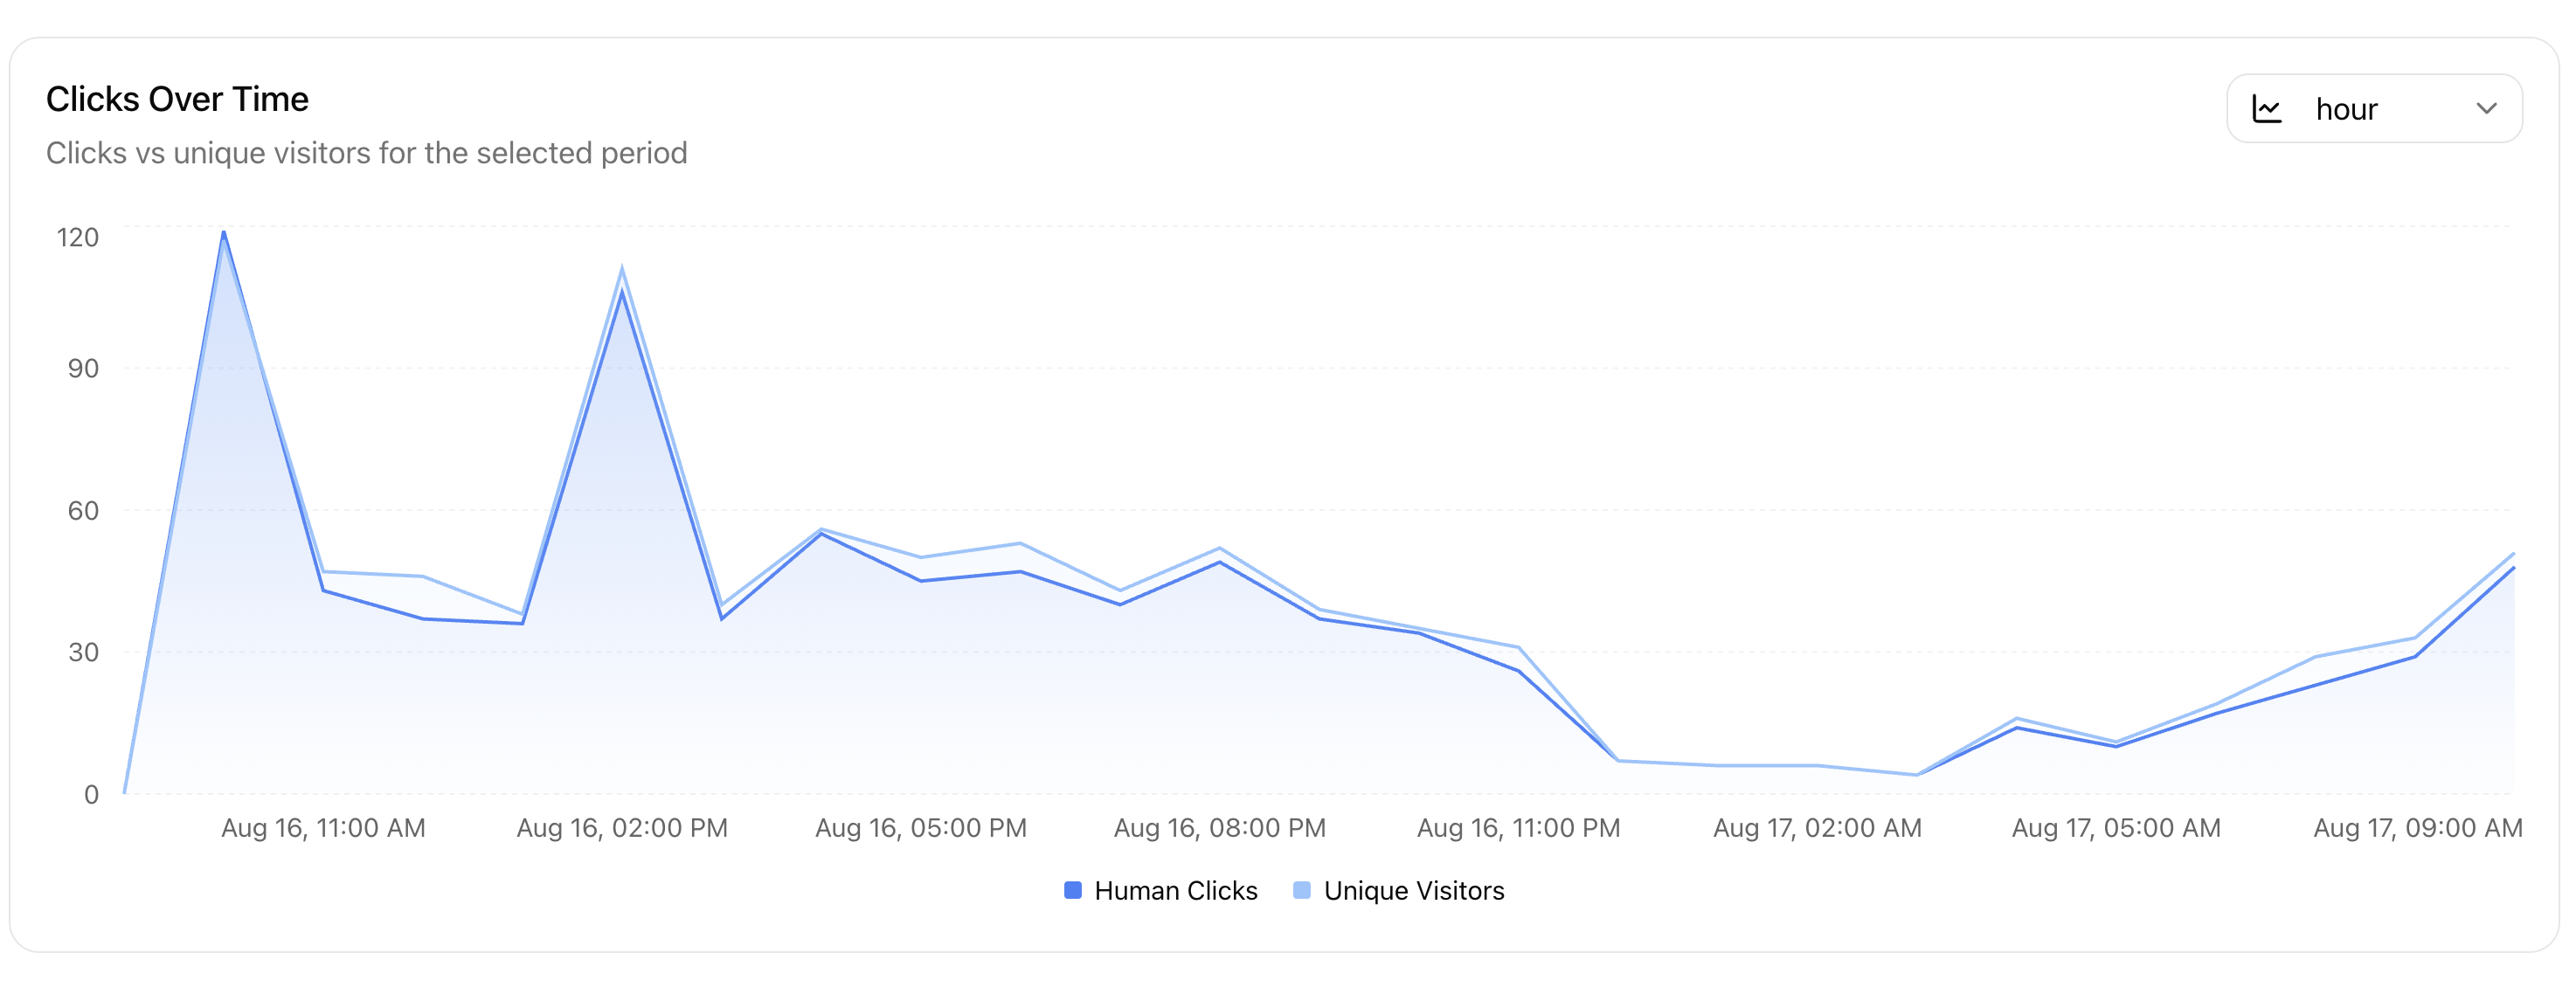
The Clicks Over Time chart shows how your traffic changes throughout the selected period.
It compares:
- Human Clicks
- Unique Visitors
This makes it easier to spot increases, drops, unusual traffic spikes, or longer-term trends.
You can also change the chart interval depending on the selected date range, for example viewing the data by day.
If the current day is still in progress, the latest point on the chart may appear lower because only part of the day's traffic has been collected.
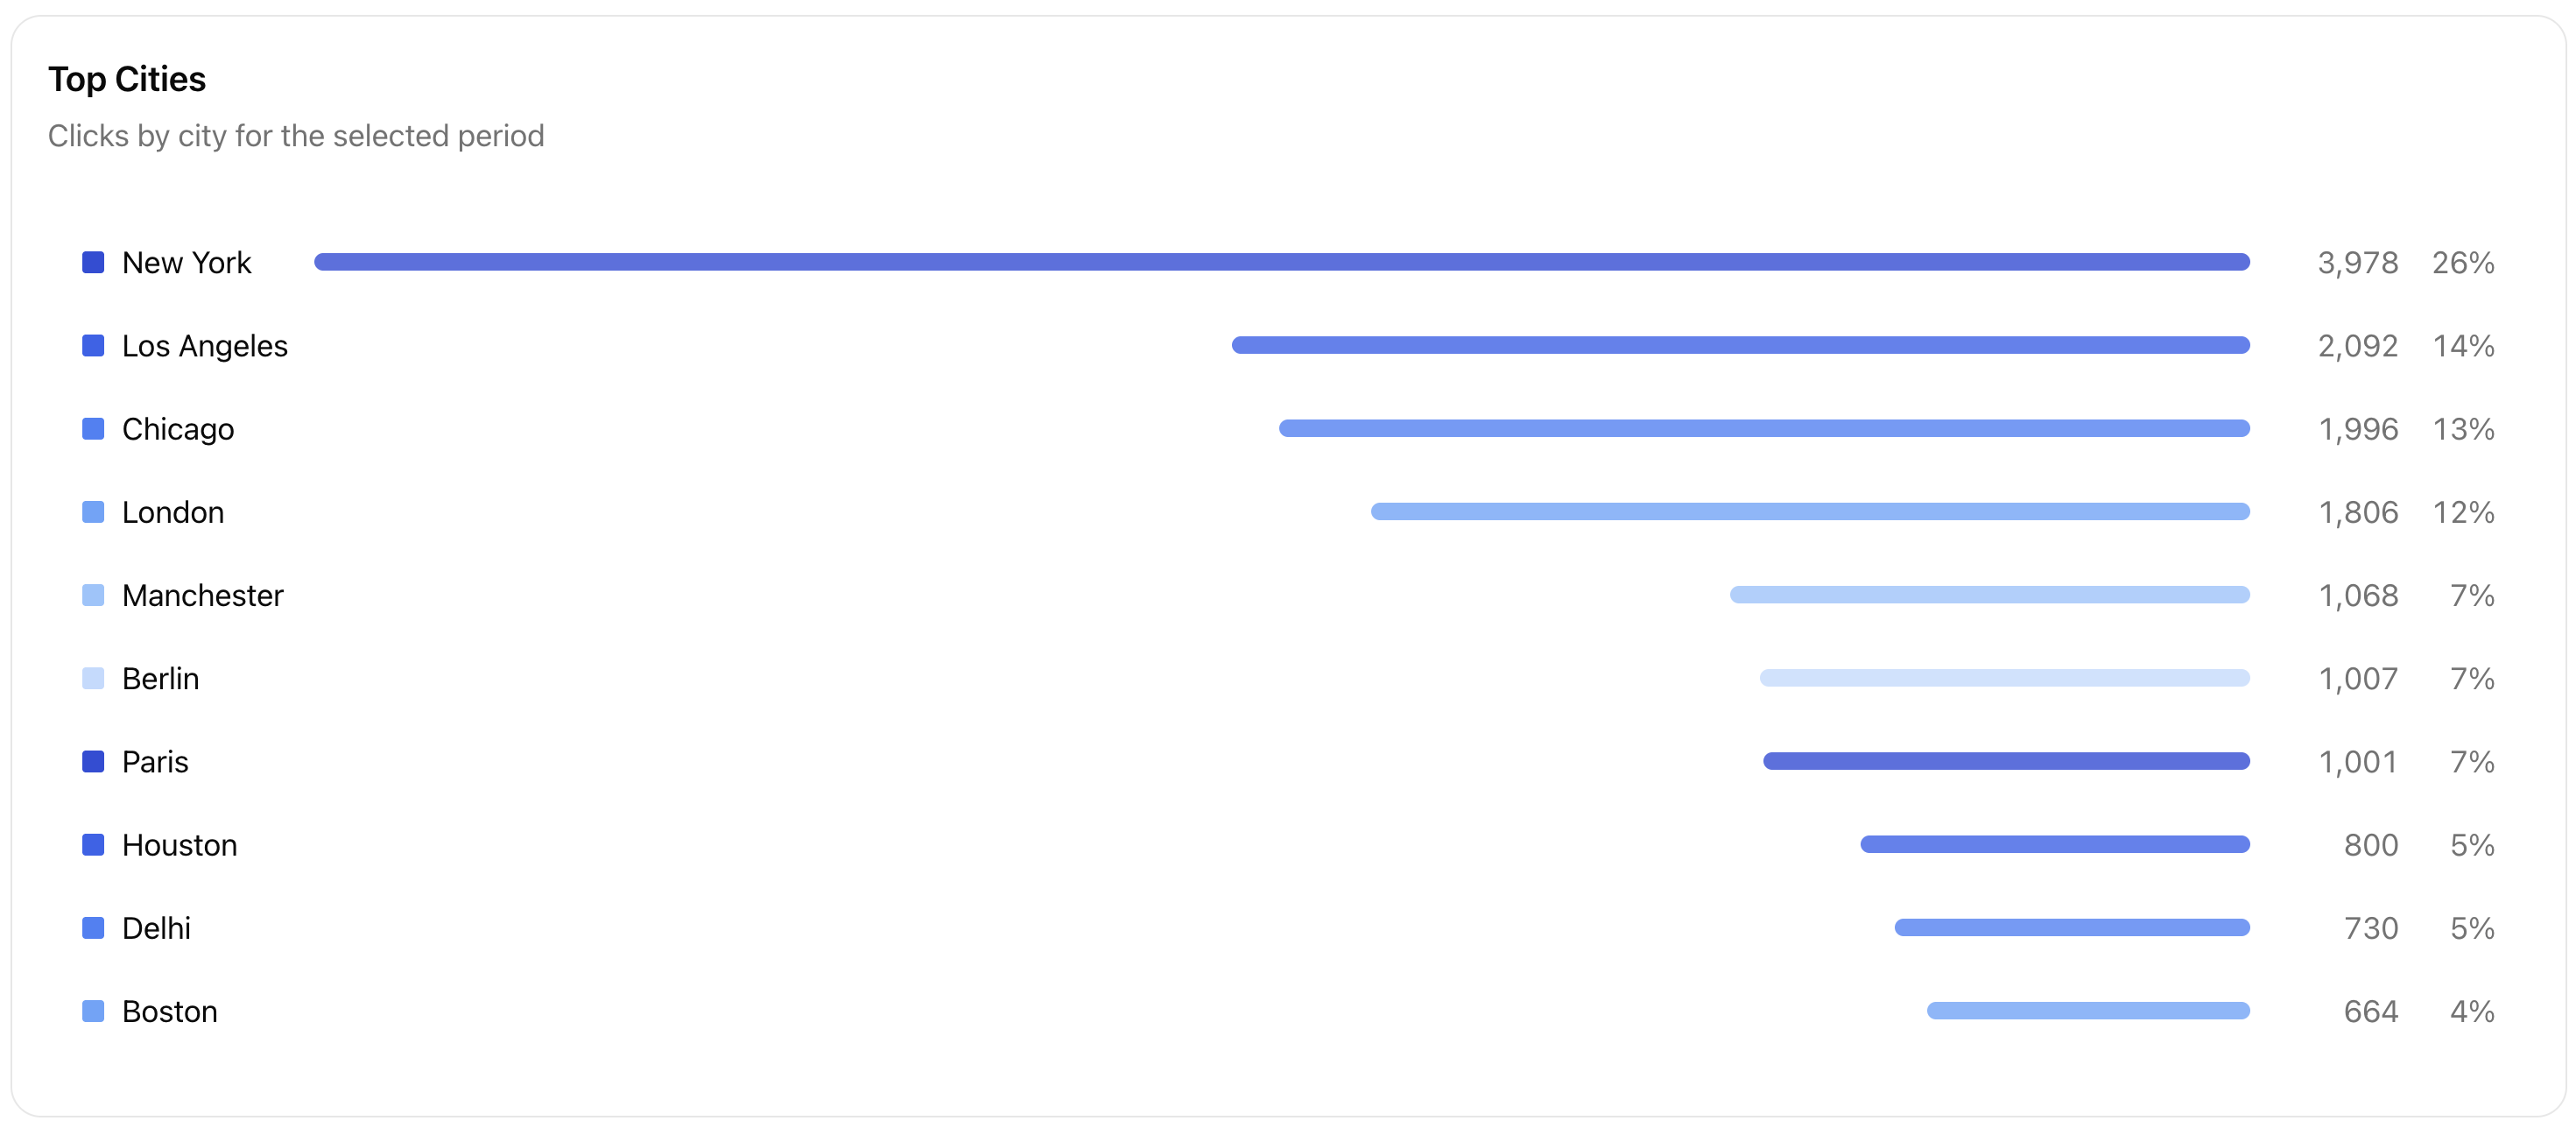
Top Countries & Cities
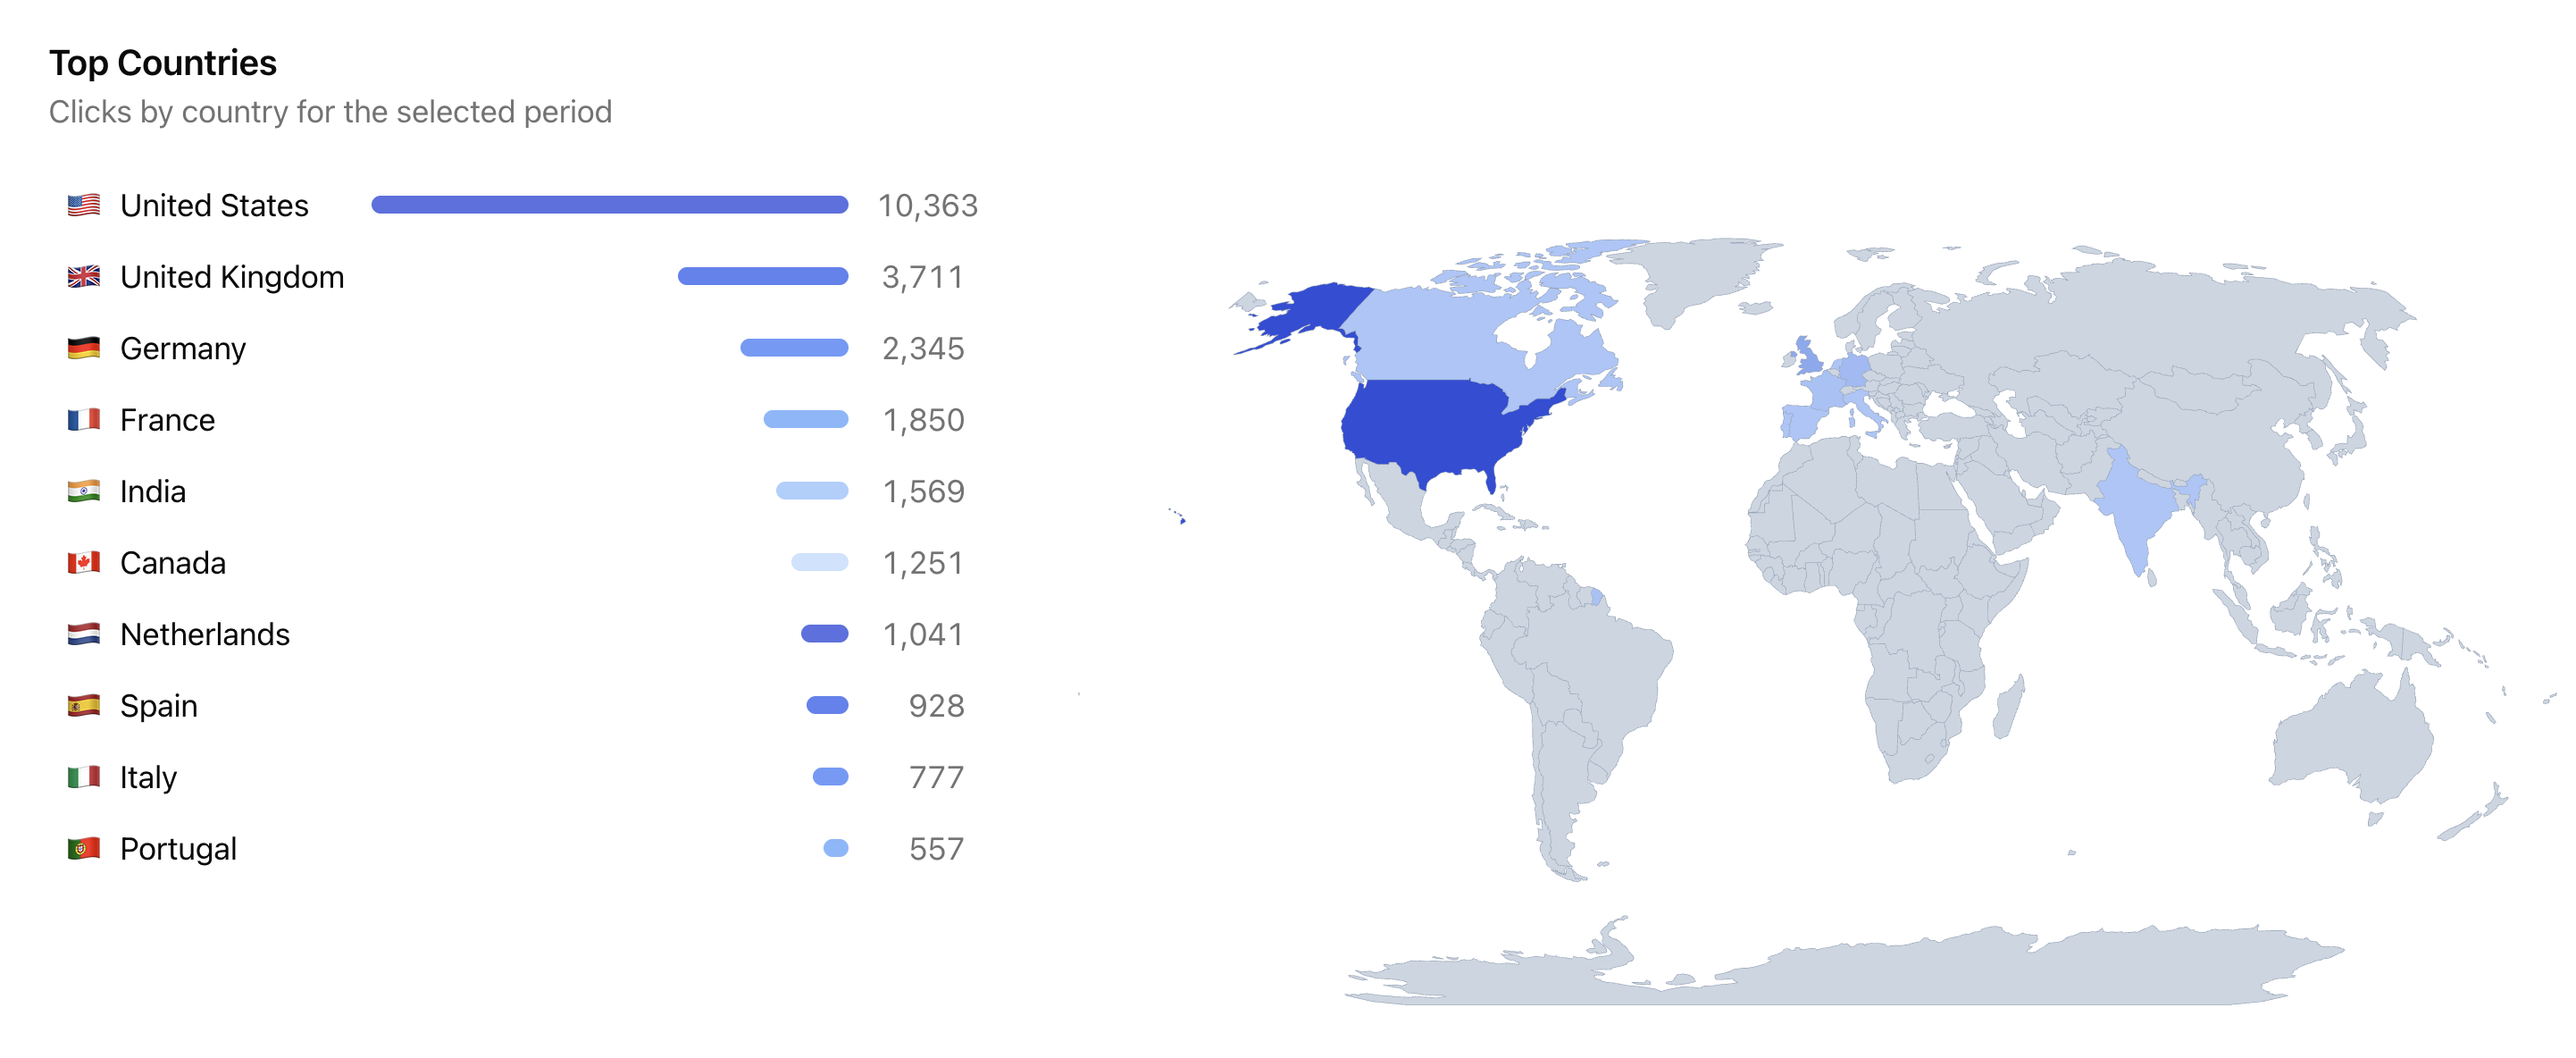
The Top Countries & Top Cities sections shows where your clicks are coming from.
You can see the countries generating the most traffic together with the number of clicks from each country.
The map gives you a quick visual overview of where your audience is located.
Country information is determined from the visitor's network location and should be treated as an estimate.
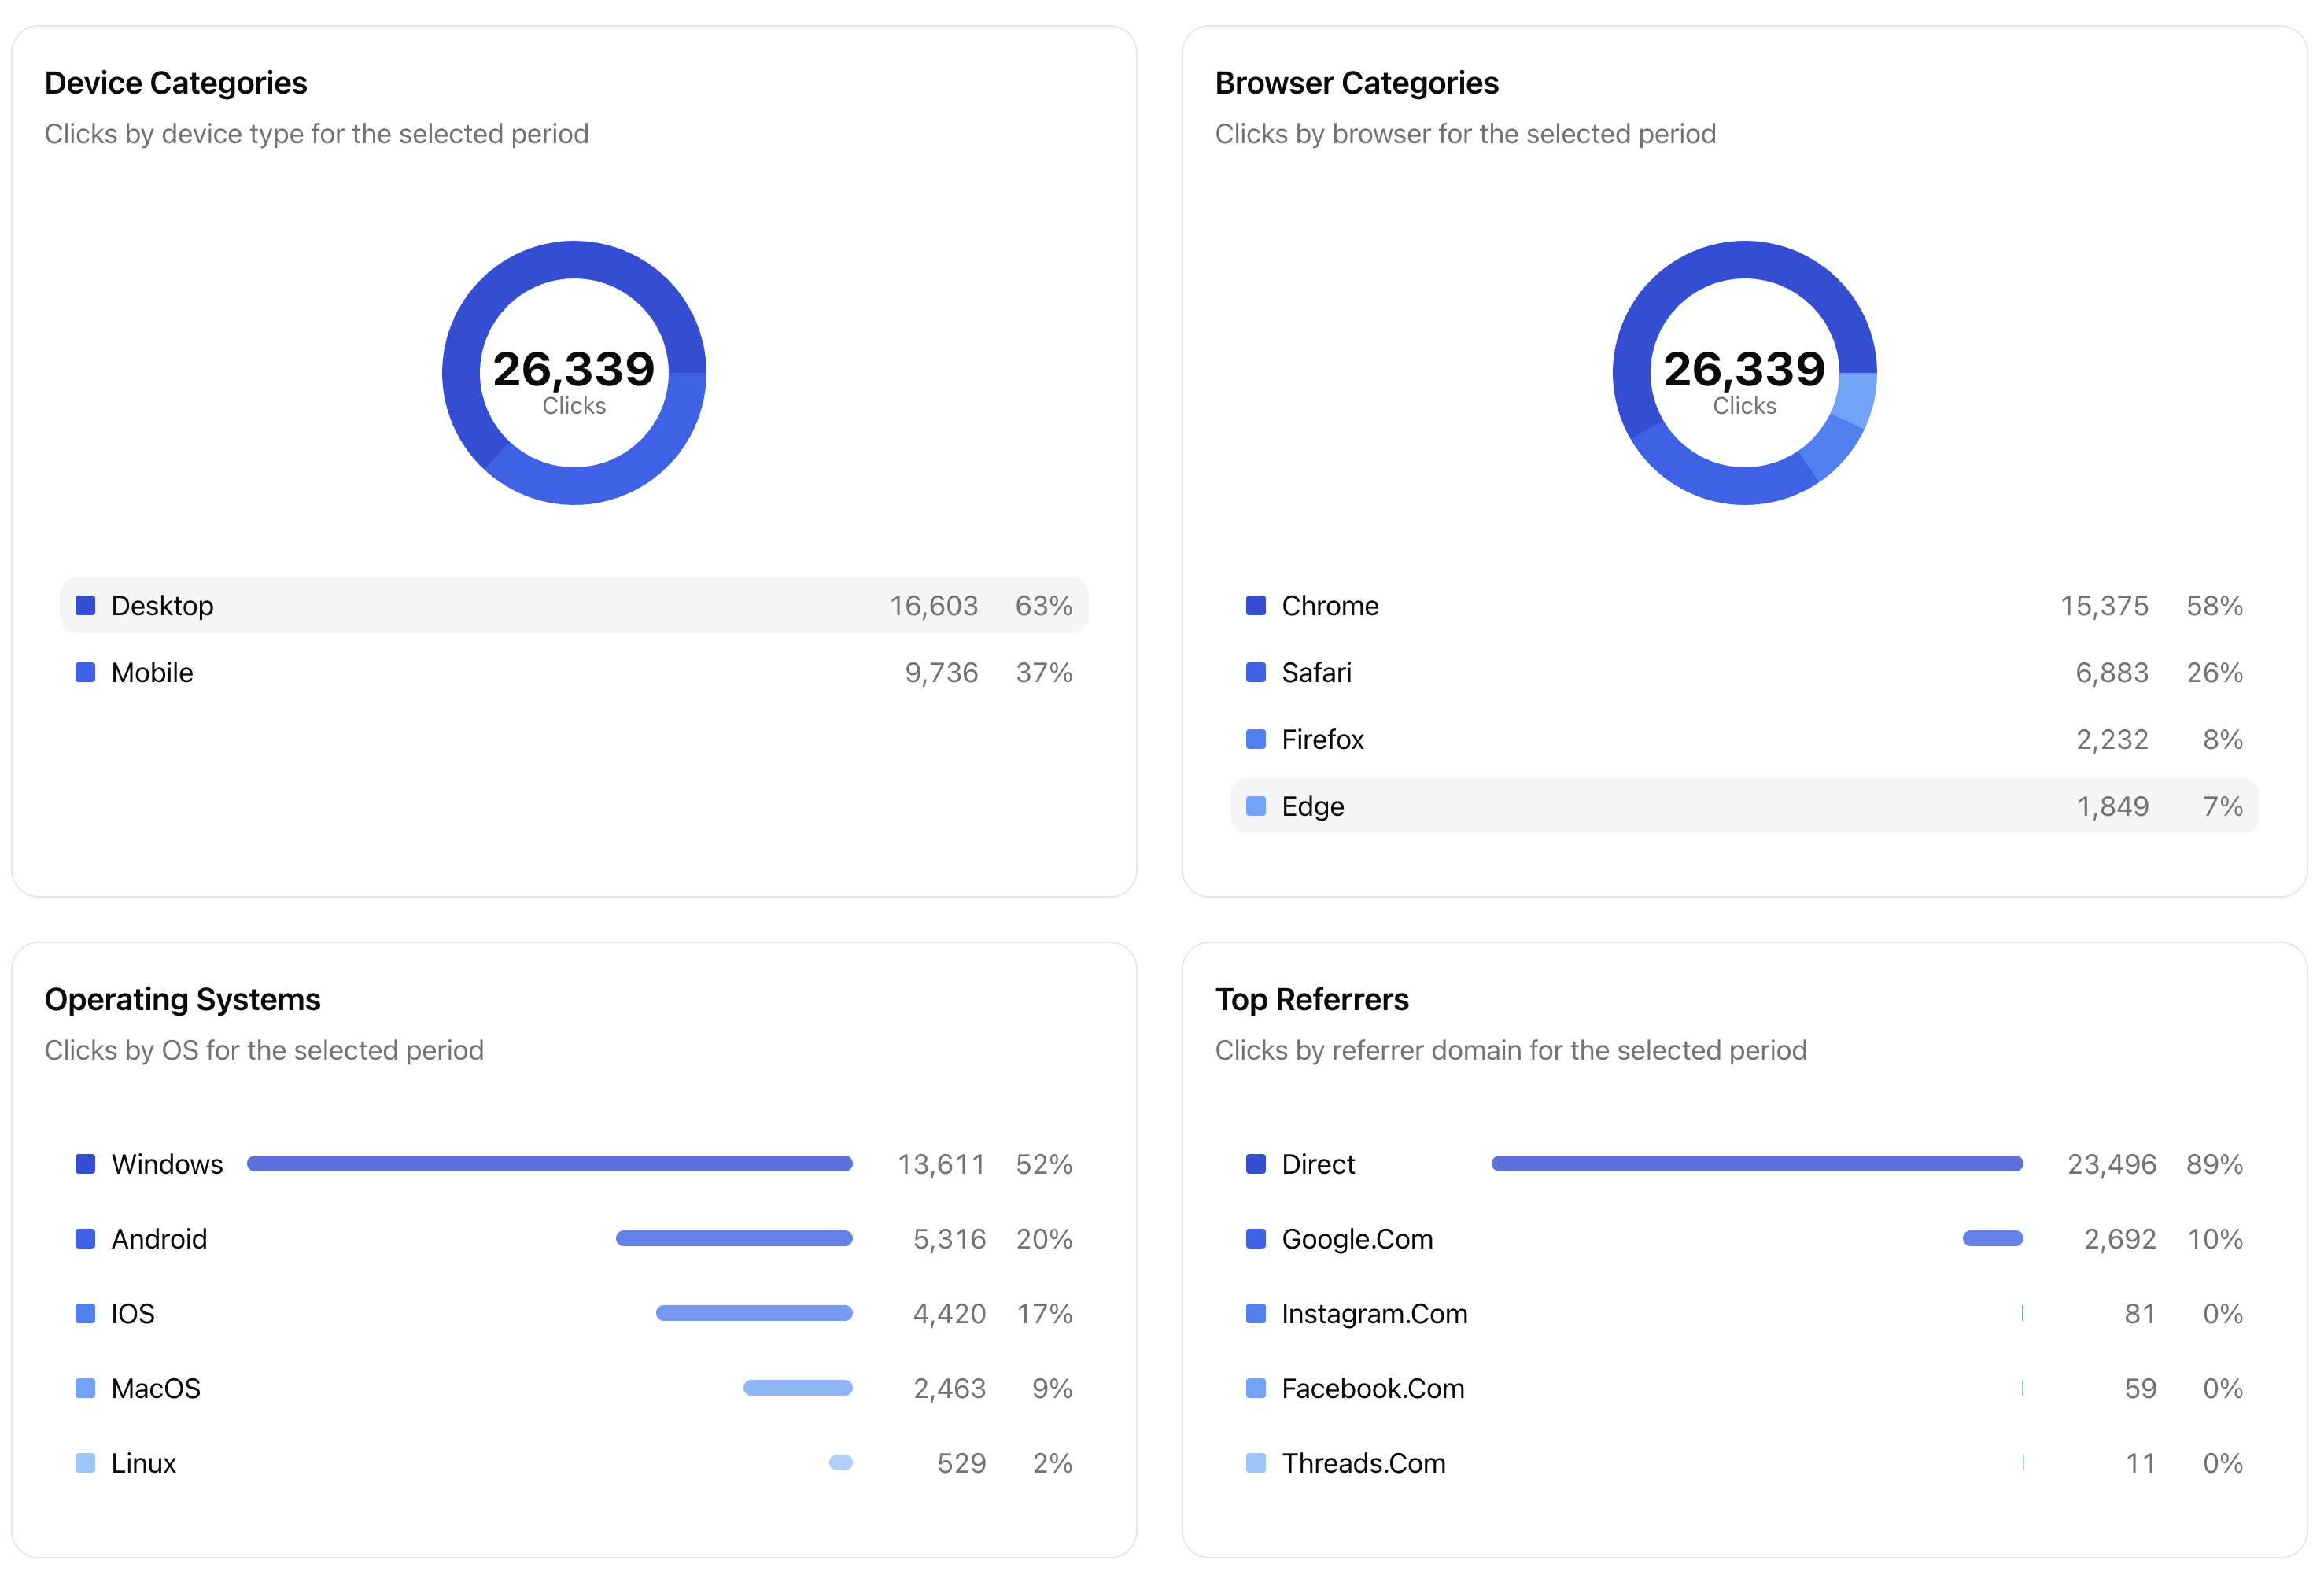
Device Categories
The Device Categories section shows which types of devices visitors use to open your links.
Traffic is grouped into categories such as:
- Desktop
- Mobile
Both the number of clicks and the percentage of total traffic are shown.
This can help you understand whether your audience mainly visits from phones or computers.
Browser Categories
Browser Categories shows which web browsers are used to open your links.
Examples can include:
- Chrome
- Safari
- Firefox
- Edge
Each browser shows its number of clicks and share of total traffic.
Operating Systems
The Operating Systems section shows which operating systems your visitors use.
Examples include:
- Windows
- Android
- iOS
- macOS
- Linux
This gives you another way to understand the devices and platforms used by your audience.
Top Referrers
Top Referrers shows which websites or services visitors were using before opening your short link.
For example, traffic may come from:
- Threads
- Other websites
Direct Traffic
You may also see a large amount of traffic listed as Direct.
Direct means that Ownlink did not receive information about a referring website.
This commonly happens when someone:
- Types or pastes the link directly
- Opens a link from a messaging application
- Opens a link from some mobile applications
- Uses a bookmark
- Opens a link from a source that does not pass referral information
Because of this, Direct traffic does not necessarily mean that someone manually typed the URL.
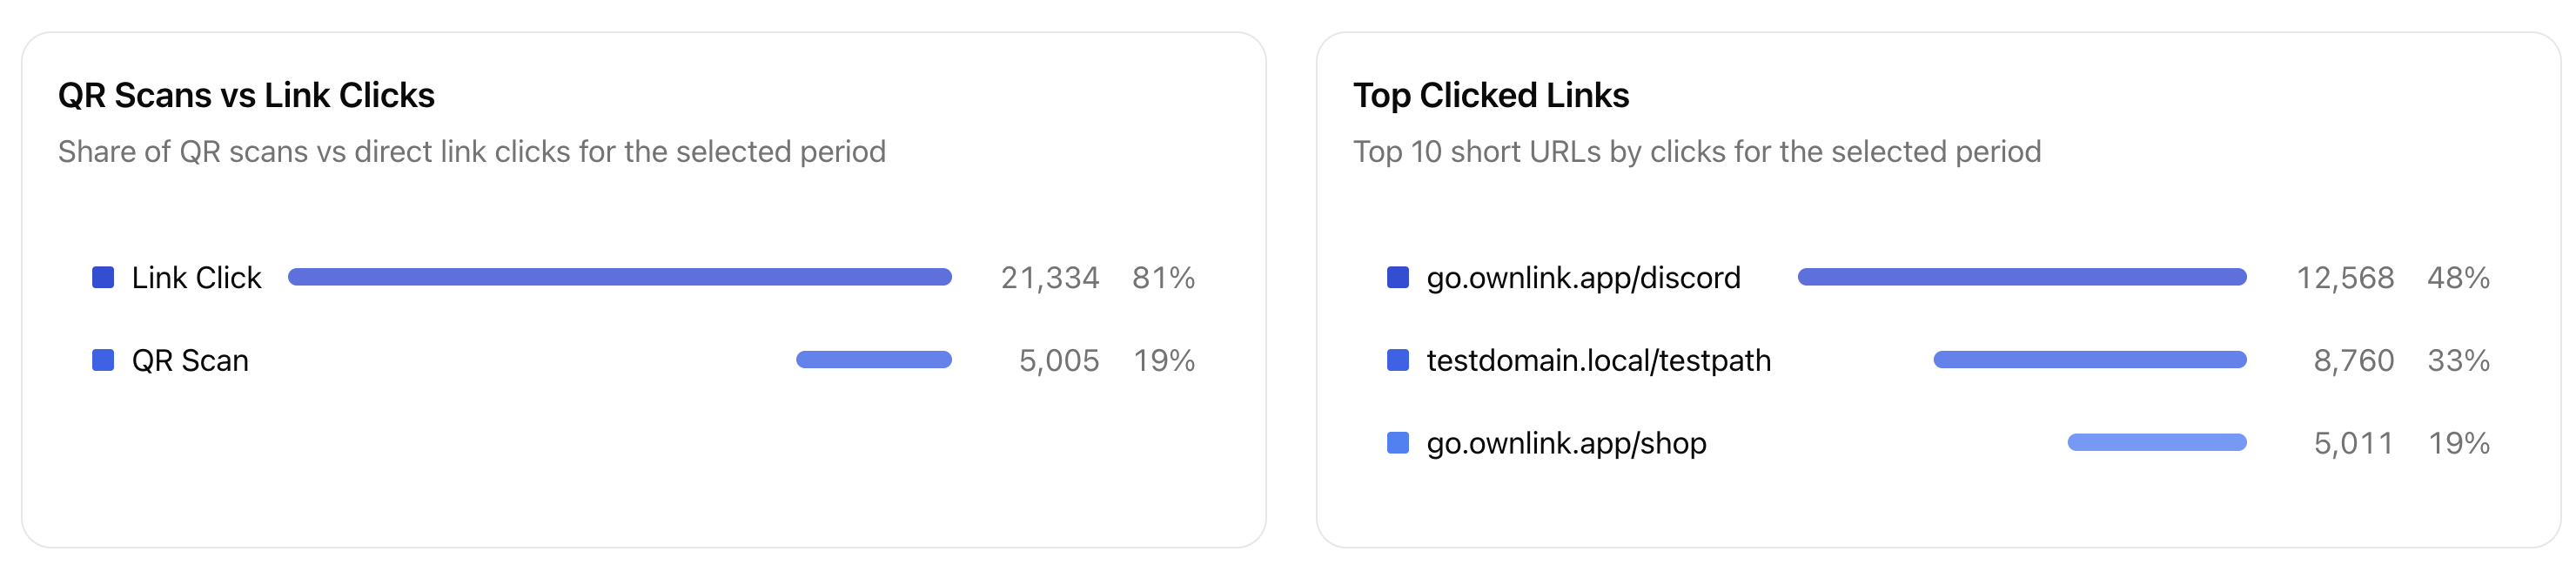
QR Scans vs Link Clicks
If you use Ownlink QR codes, the QR Scans vs Link Clicks section shows how visitors reached your short URLs.
Traffic is divided between:
- Link Click — the short link was opened normally.
- QR Scan — the visit originated from an Ownlink QR code.
The dashboard shows both the number and percentage of visits from each source.
This can help you measure how much traffic your printed materials, packaging, posters, menus, business cards, or other QR placements generate.
Top Clicked Links
Top Clicked Links shows which of your short URLs received the most clicks during the selected period.
For every link, you can see:
- Short URL
- Number of clicks
- Percentage of traffic represented by that link
This makes it easy to quickly identify your most frequently used or best-performing links.
Analytics for an Individual Link
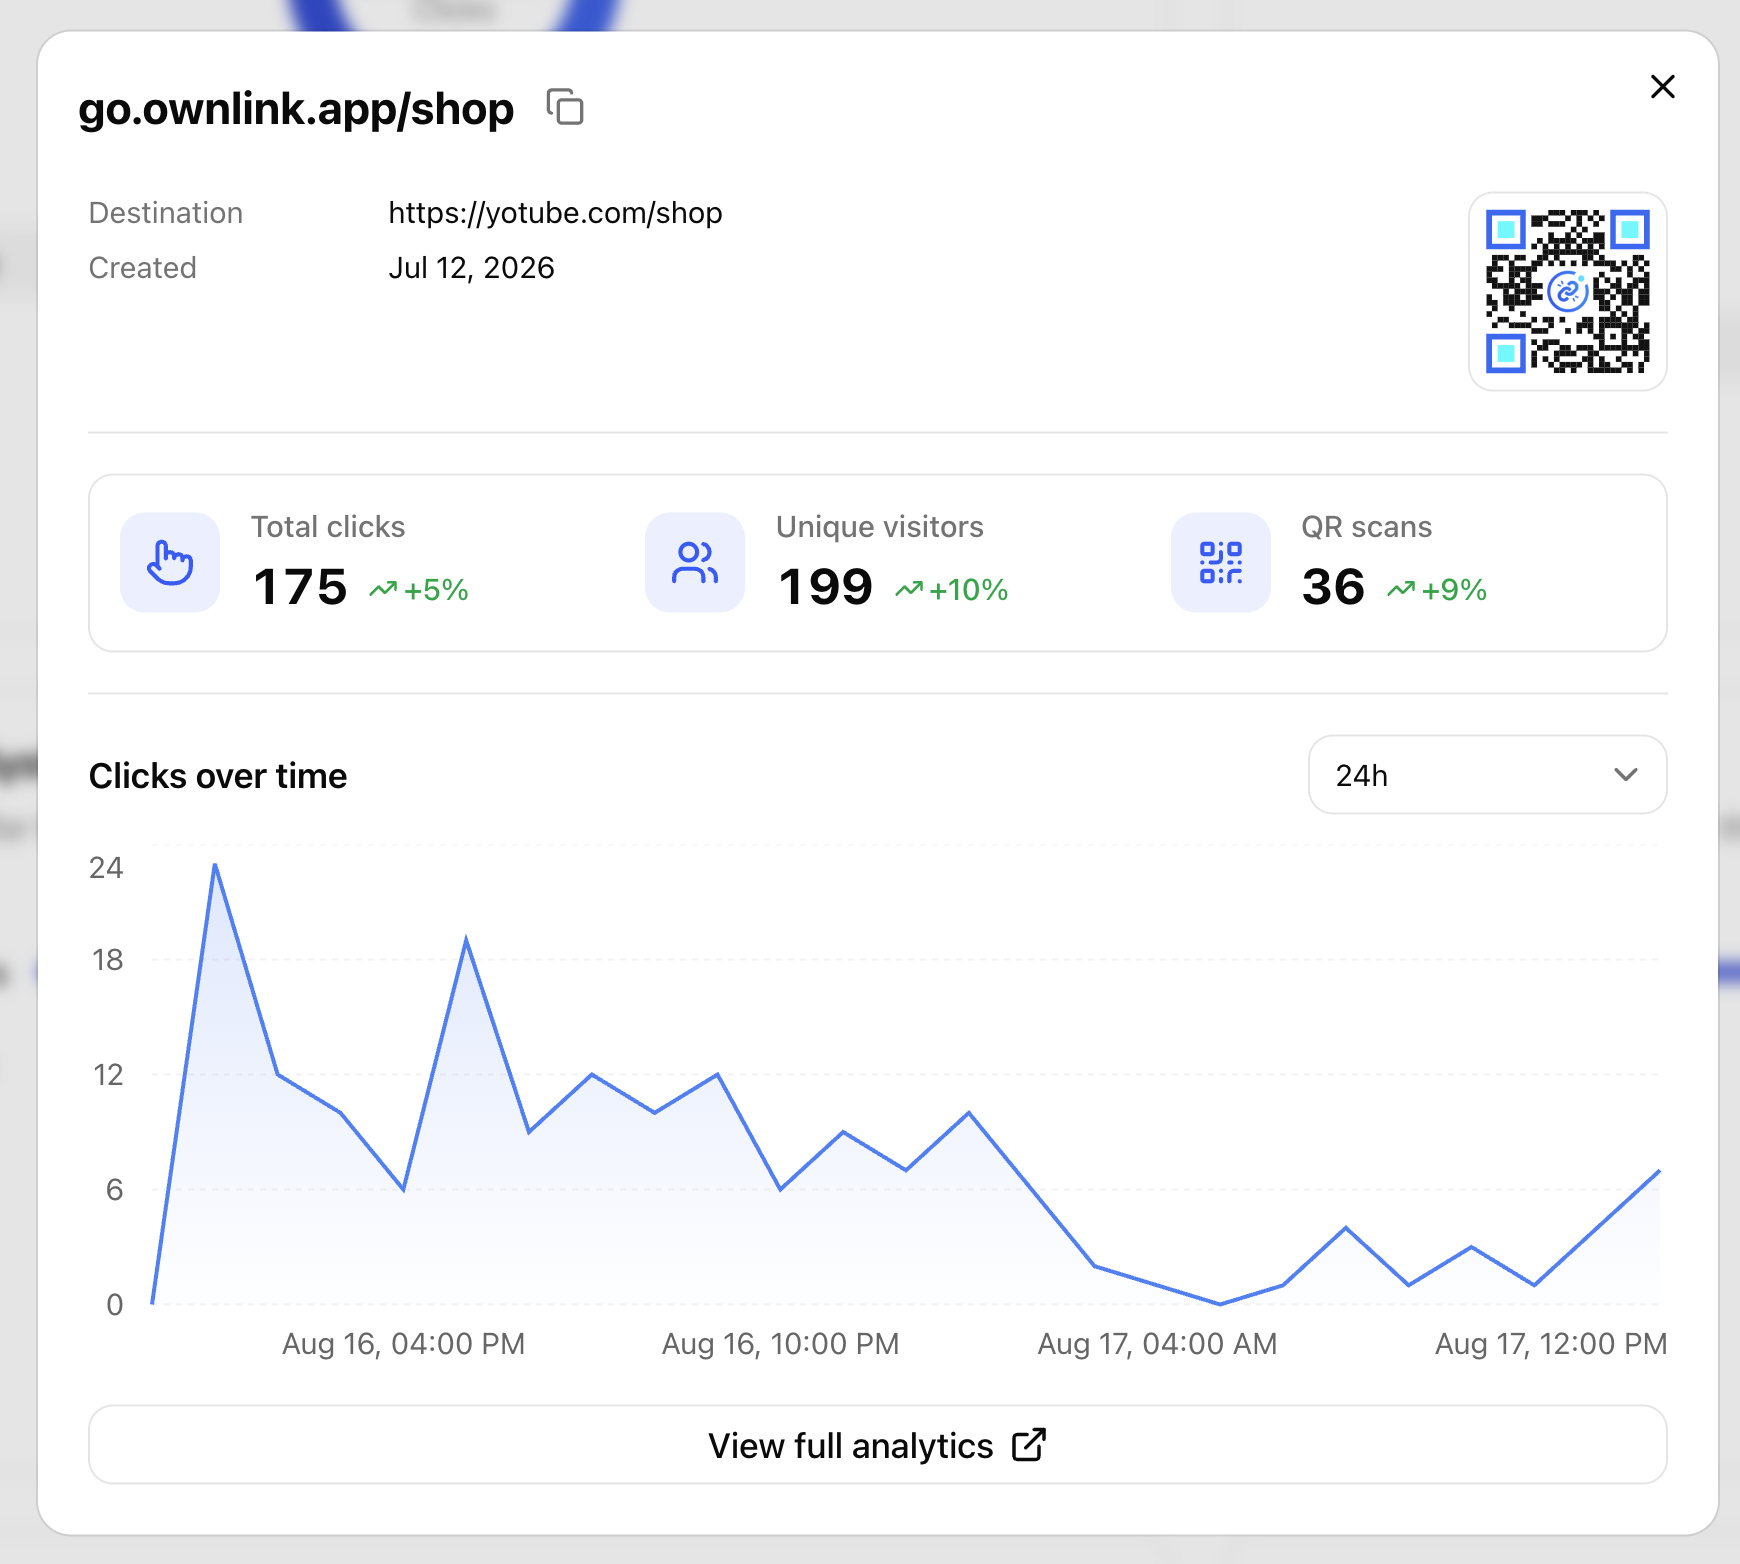
You can also view analytics for one specific short link.
The link analytics overview displays basic information about the link, including its:
- Short URL
- Destination URL
- Creation date
- QR code
It also provides important performance statistics for that link.
Total Clicks
Shows how many times the link was opened.
Unique Visitors
Shows the estimated number of different visitors who opened the link.
QR Scans
Shows how many visits came through the QR code associated with the link.
Clicks Over Time
The chart lets you quickly see how the link has performed over a selected period, such as the last 30 days.
You can use View full analytics when you want to explore the link using the complete Analytics dashboard and its additional reports and filters.
Understanding Analytics Accuracy
Ownlink analytics are designed to give you a useful picture of how your links are being used, but some values should be treated as estimates.
For example:
- One person may use multiple devices or browsers.
- Several people may sometimes use the same network or device.
- VPNs and mobile networks can affect location detection.
- Some applications do not provide referrer information.
- Automated traffic may not always be possible to identify perfectly.
For this reason, analytics are best used to understand traffic patterns, performance, and trends rather than to identify individual people.